

 Open Access
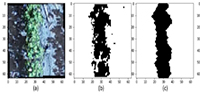
Embracing smart irrigation management techniques empowers growers to irrigate with greater efficiency, thereby promoting sustainable agricultural production. In this context, growers often rely on crop evapotranspiration (ETc) as a key factor in making informed irrigation decisions, underscoring the significance of accurately determining and spatially mapping crop water status. Technological progress, exemplified by the emergence of unmanned aerial vehicles (UAVs), has brought about a revolutionary shift in agricultural monitoring. UAV platforms can capture high-resolution images with centimeter-level spatial accuracy and offer higher temporal coverage compared to satellite imagery. Considering these advancements, this study introduces a robust method for classifying water stress in cotton using a compact UAV platform and convolutional neural networks (CNN). The experiment was conducted at the USDA-ARS Cropping Systems Research Laboratory (CSRL) in Lubbock, Texas, where the cotton field was divided into 12 drip zones. The study included three replications to evaluate four irrigation treatments: “rainfed”, “full irrigation”, “percent deficit of full irrigation”, and “time delay of full irrigation”. The results demonstrated that the CNN model successfully classified the cotton water stress using the UAV-based RGB image, achieving an overall best prediction accuracy of approximately 91%. By segmenting the original cotton images into separate canopy and soil areas using morphological image processing methods, the authors also isolated and analyzed the individual contributions of these components to cotton water stress. Additionally, a random forest classifier revealed the relative importance of different image features in the classification process through feature importance analysis. These findings highlighted the state-of-the-art performance of the proposed system in cotton water stress classification and provided valuable insights into the key image features contributing to accurate classification. The authors concluded that integrating UAV-based RGB imagery and CNN models had great potential for assessing water stress in cotton.
Open Access
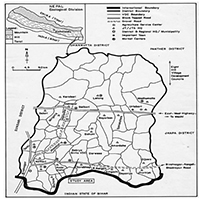
Wundanyi sub-catchment of Taita hills is experiencing a high rate of deforestation due to the conversion of all its original forestland to agriculture and settlement during the last century. The landscape dynamics coupled with rainfall fluctuations in these critical ecosystems may significantly affect water resource distribution and food security in Taita Taveta County and its environs. This study aimed to establish the trends of selected hydroclimatic variables in Wundanyi sub-catchment from 1970 to 2030 and their specific and combined effects on surface runoff and streamflow in the same period. The analysis was based on statistical trend analysis and dynamic landscape modelling using both historical and primary hydroclimatic data from Wundanyi and Voi weather stations. Results show highly variable mean seasonal and annual values of temperature, rainfall, runoff and discharge in both Wundanyi and Voi weather stations. Increasing mean temperatures and rainfall were observed during the long dry season (JJAS), while decreasing seasonal discharges were observed during both the JJAS dry season and the OND short rainy season. These anomalies were pronounced in 1980–1981, 1986–1987 and 1992–1993, probably due to both global and local environmental changes affecting Taita Hills in general and Wundanyi sub-catchment in particular. The predicted effects of rainfall fluctuation were supported by declining surface runoff of 1.3% during JJAS, and an increase of 0.8% during the OND, with similar effects on river discharges. The combined effects of climate variability and Land use and cover changes (LUCC) on surface runoff were estimated to an increase of 200 mm during JJAS and 370 mm during OND, and while river discharges increased by 2.37 m3/s and 1.93 m3/s during JJAS and OND, respectively. Consequently, natural forest covers have significant control effects on surface runoff and can boost river discharges amid diverse agricultural cropping practices. Hence, crop diversification, agroforestry, and soil and water conservation structures are recommended to maintain effective control of LUCC on hydrological processes going on in Wundanyi sub-catchment.
Open Access
We studied the relationship of the yield of winter wheat and spring barley with slope exposure components in the west of the Oka River basin. The size of the study area was 250 km by 360 km. The yield characteristics included the maximal yield obtained when applying the optimal dose of fertilizers, the yield without applying fertilizers (control), and the maximal addition to yield, that is, their difference. The addition is shown to be most sensitive to climatic factors. For wheat, the addition increased on the warmer southwestern slopes, and for barley—on the wetter north-eastern slopes. The high sensitivity of the addition of barley to moisture is shown using its comparison with climatic water deficit. To compare slopes by the energy of incident solar radiation, we used the slope insolation in energy units. Although the difference in energy between the southwest and northeast slopes was only 2.2%, wheat addition on these slopes varied by more than a factor of two. The reasons for this are discussed. The results obtained show that when choosing locations for crop areas, it is advisable to take into account the exposure of the slopes.
Open Access
Information on the distribution of soil properties is important to know the status of nutrients in the soils based on which fertilizer nutrients are recommended. Given the variability of nutrients in the soils, making a site-specific fertilizer recommendation seems to be a compelling work. To determine the spatial variability of soil nutrients and to make judicious and precise fertilizer recommendations, new measures are designed with this study. These measures are tested against the soil samples (n = 43) for total nitrogen (N), organic matter (OM), phosphorus (P2O5), and potassium (K2O) in the study area. The descriptive statistical analysis indicated an average of low nitrogen and organic matter, while phosphorus was found to be very high and the level of potassium was high. The spread of nutrients across the data sets, however, included low, medium, high, and very high levels of ratings. The Deviation Square Index was developed and applied for the variability measurement and found that the largest variation was with phosphorus distribution, followed by potassium, nitrogen, and organic matter. The coefficient of variation (CV%) analysis also exhibited similar trends in nutrient distributions. Nitrogen was the main determinant explaining the variations in rice yield, while phosphorus and potash were negatively related to the yield. An index of fertilizer nutrient recommendation called Test-Value Specific Dose (TVSD) was developed and used to calculate the nutrient recommendation for each sampled location. This new method gave easy and more accurate doses of fertilizer over the blanket recommendation to fit the variations across the soil samples.
Open Access
The Wundanyi sub-catchment of Taita Hills is experiencing a high rate of deforestation due to the conversion of all its original forestland to agriculture and settlement during the last century. The landscape dynamics coupled with rainfall fluctuations in these critical ecosystems may significantly affect water resource distribution and food security in Taita Taveta County and its environs. This study aimed to establish the trends of selected hydroclimatic variables in the Wundanyi sub-catchment from 1970 to 2030 and their specific and combined effects on surface runoff and streamflow during the same period. The analysis was based on statistical trend analysis and dynamic landscape modeling using both historical and primary hydroclimatic data from Wundanyi and Voi weather stations. Results show highly variable mean seasonal and annual values of temperature, rainfall, runoff, and discharge in both Wundanyi and Voi weather stations. Increasing mean temperatures and rainfall were observed during the long dry season (JJAS) while decreasing seasonal discharges were observed during both the JJAS dry season and the OND short rainy season. These anomalies were pronounced in 1980–1981, 1986–1987, and 1992–1993, probably due to both global and local environmental changes affecting Taita Hills in general and the Wundanyi sub-catchment in particular. The predicted effects of rainfall fluctuation were supported by declining surface runoff of 1.3% during JJAS, and an increase of 0.8% during the OND, with similar effects on river discharges. The combined effects of climate variability and land use and cover changes (LUCC) on surface runoff were estimated to increase by 200 mm during JJAS and 370 mm during OND, while river discharges increased by 2.37 m3/s and 1.93 m3/s during JJAS and OND, respectively. Consequently, natural forest covers have significant control effects on surface runoff and can boost river discharges amid diverse agricultural cropping practices. Hence, crop diversification, agroforestry, and soil and water conservation structures are recommended to maintain effective control of LUCC on hydrological processes going on in the Wundanyi sub-catchment.

Prof. Zhengjun Qiu
Zhejiang University, China

Cheng Sun
Academician of World Academy of Productivity Science; Executive Chairman, World Confederation of Productivity Science China Chapter, China
Indexing & Archiving

.jpg)
.jpg)

.jpg)


In the realm of modern agriculture, the integration of cutting-edge technologies is revolutionizing the way we approach sustainable farming practices. A recent study published in Advances in Modern Agriculture titled "Classification of cotton water stress using convolutional neural networks and UAV-based RGB imagery" has garnered significant attention for its innovative approach to precision irrigation management. Conducted by researchers from Institute of Data Science and the AgriLife Research and Extension Center of Texas A&M University (authors's information is below). This study introduces a novel method for classifying cotton water stress using unmanned aerial vehicles (UAVs) and convolutional neural networks (CNNs), offering a powerful solution for optimizing water use in agriculture.
Modern agricultural technology is evolving rapidly, with scientists collaborating with leading agricultural enterprises to develop intelligent management practices. These practices utilize advanced systems that provide tailored fertilization and treatment options for large-scale land management.
This journal values human initiative and intelligence, and the employment of AI technologies to write papers that replace the human mind is expressly prohibited. When there is a suspicious submission that uses AI tools to quickly piece together and generate research results, the editorial board of the journal will reject the article, and all journals under the publisher's umbrella will prohibit all authors from submitting their articles.
Readers and authors are asked to exercise caution and strictly adhere to the journal's policy regarding the usage of Artificial Intelligence Generated Content (AIGC) tools.
Asia Pacific Academy of Science Pte. Ltd. (APACSCI) specializes in international journal publishing. APACSCI adopts the open access publishing model and provides an important communication bridge for academic groups whose interest fields include engineering, technology, medicine, computer, mathematics, agriculture and forestry, and environment.